
From raw data to data-driven healthcare recommendations
Our client runs a medical app that serves both doctors and patients, generating a vast and diverse pool of healthcare data. To harness its full potential, we set out to develop a disease prediction model - one capable of transforming raw medical records into meaningful outcomes. However, the dataset presented significant challenges: inconsistencies in format and measurement units, gaps in the data, and unstructured doctor notes spanning multiple languages. This blog details our journey - from data preprocessing to predictive modeling - and how we turned complex medical data into actionable insights.
Ethical considerations in medical data processing
Before we proceed with any analysis, it is crucial to ensure that our data respects user privacy and aligns with ethical standards. Our primary objective is to enhance healthcare quality for the entire population, not to identify individuals based on names, locations, or any other personally sensitive details.
To achieve this, we are taking privacy-preserving measures:
- Data Anonymization: We remove personally identifiable information (PII) while maintaining critical patterns and signals intact. This allows our models to learn from the data effectively without risking patient re-identification. For location data, we convert addresses into latitude and longitude coordinates with added noise to maintain privacy without compromising the usefulness of spatial information.
- Secure Data Processing: All data processing, including natural language processing (NLP) on doctor notes, is performed in a controlled environment. We use locally hosted large language models (LLMs) to extract important information while avoiding sending them to the cloud LLM providers to prevent sensitive data exposure.
- Model Selection & Reverse Engineering Prevention: Our predictive models are designed to prevent the reconstruction of individual patient records. By ensuring that no single component of the model has full visibility into the raw data, we make it significantly harder to reverse-engineer personal details. Additionally, we fine-tune our models to prevent overfitting so they generalize well without memorizing individual patient details.
In summary, our approach prioritizes privacy by anonymizing data, processing it securely within controlled environments, and using models designed to protect patient identities. While we aim to align with healthcare data privacy standards such as HIPAA, our focus remains on safeguarding sensitive information and maintaining data security. This ensures that we deliver impactful healthcare insights while adhering to the highest ethical standards.
Data cleaning & preprocessing: Laying the foundation for reliable insights
Before performing any analysis, it's crucial to ensure that the data is clean, consistent, and ready for processing. Our journey began with raw medical data that needed substantial cleaning and preprocessing. We had to tackle challenges such as standardizing units, dealing with missing data, and ensuring that the data was structured for accurate analysis. Here’s how we handled these challenges:
Standardizing data formats
A major challenge in preprocessing healthcare data is dealing with inconsistent units of measurement. For example, weight can be recorded in kg or lbs, and height can be recorded in cm or inches. To standardize the data, we performed thorough checks across multiple unit combinations for attributes like weight, height, and age to ensure that the Body Mass Index (BMI) was calculated correctly.
We tested several combinations of these units and selected the one that consistently provided the correct BMI. If no correct combination could be found (e.g., conflicting unit formats), we treated those records as outliers and removed them from the dataset to avoid skewing the analysis.
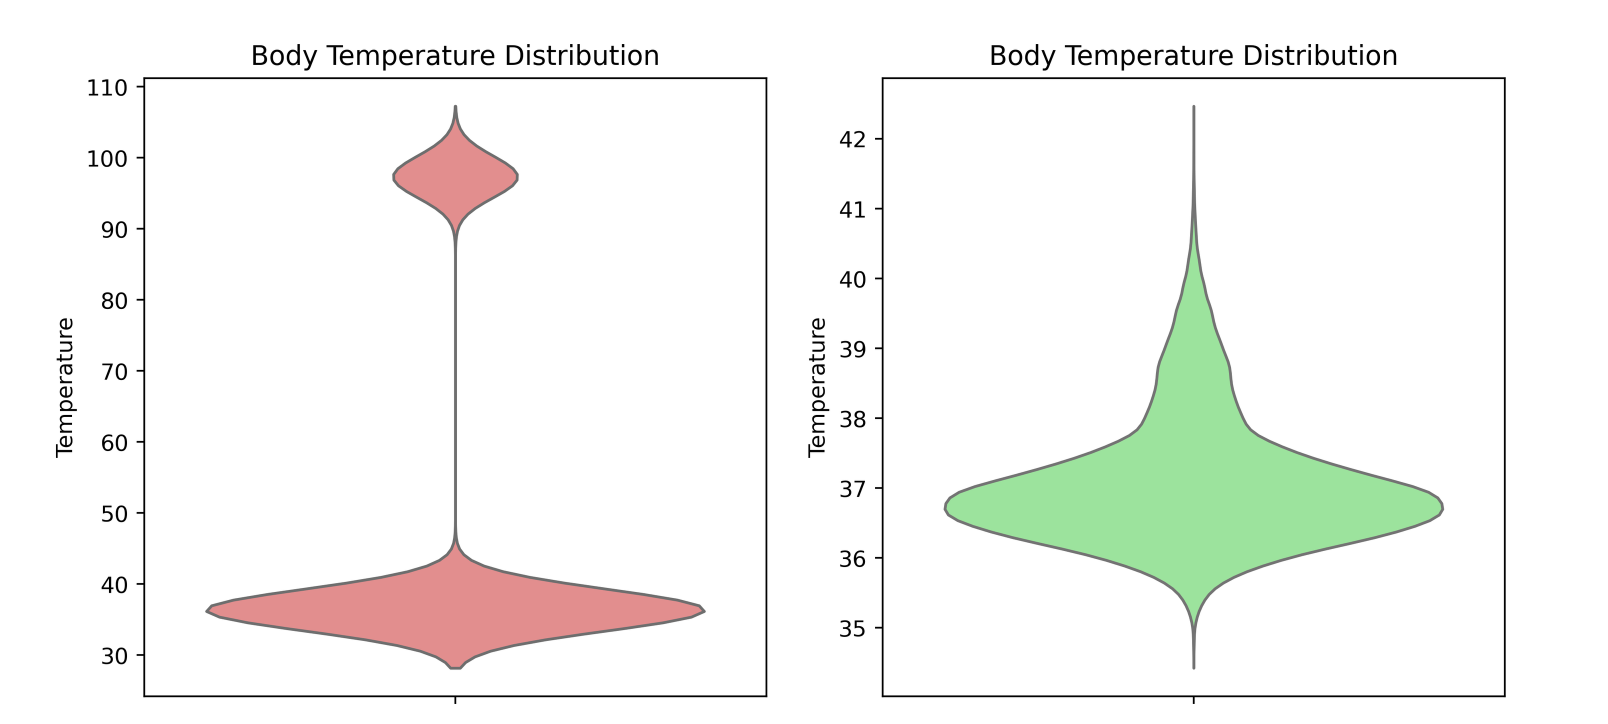
To illustrate the importance of standardizing data formats, take a look at the violin plot below. This plot represents the distribution of temperature readings, and it shows two distinct "blobs" around 37°C and 98°F. These two groups likely represent temperature measurements taken in Celsius and Fahrenheit units. Standardizing the data formats ensured that we were comparing apples to apples, rather than mixing data in different units.
Handling missing data
After standardizing the data, we encountered missing values in several fields. To handle this, we used the Iterative Imputer from the scikit-learn library. This powerful technique models each feature with missing values as a function of other features in the dataset, iteratively imputing missing values based on the available data.
This method allowed us to fill in missing values without introducing bias, ensuring that our analysis remained robust and reliable.
Normalizing medical terminology
In medical datasets, particularly those containing doctor's notes or free text entries, there can be inconsistencies in how diseases and conditions are described. For example, a doctor might refer to a stroke as a "brain attack", or hypertension could be written as "high blood pressure". These variations in terminology can lead to confusion and misclassification if not standardized. To make diagnoses comparable across records, we applied semantic similarity detection using embeddings:
| Doctor's Input | Standardized Diagnosis | Similarity Score |
|---|---|---|
| 'brain attack' | Stroke | 0.59 |
| 'high blood pressure' | Hypertension | 0.86 |
| 'heart attack' | Myocardial Infarction | 0.64 |
| 'sugar disease' | Diabetes Mellitus | 0.69 |
| 'lung infection' | Pneumonia | 0.77 |
| 'attaque cérébrale' (French) | Stroke | 0.36 |
| 'pression artérielle élevée' (French) | Hypertension | 0.35 |
| 'infection pulmonaire' (French) | Pneumonia | 0.65 |
By normalizing these terms, we ensured accurate analysis and improved model performance.
Predictive modeling: Forecasting health risks
To move from raw medical data to actionable insights, we built machine learning models that predict disease risk based on patient records. Instead of providing absolute diagnoses, our models generate probability scores for various conditions, helping healthcare professionals make informed decisions.
Machine learning techniques for prediction
We experimented with multiple ML algorithms to find the most effective approaches for medical risk assessment:
- Random forest: A robust ensemble model that handles missing data well and provides feature importance insights.
- Neural networks: Deep learning models capable of capturing complex patterns in patient health data.
- Transformers: State-of-the-art deep learning architectures capable of finding connections between historical patient data and analyzing text data, such as clinical notes and medical records, to enhance risk assessment.
These models analyze structured health records - such as vital signs and patient history - to estimate the likelihood of various diseases.
Adjusting probability thresholds for better decision-making
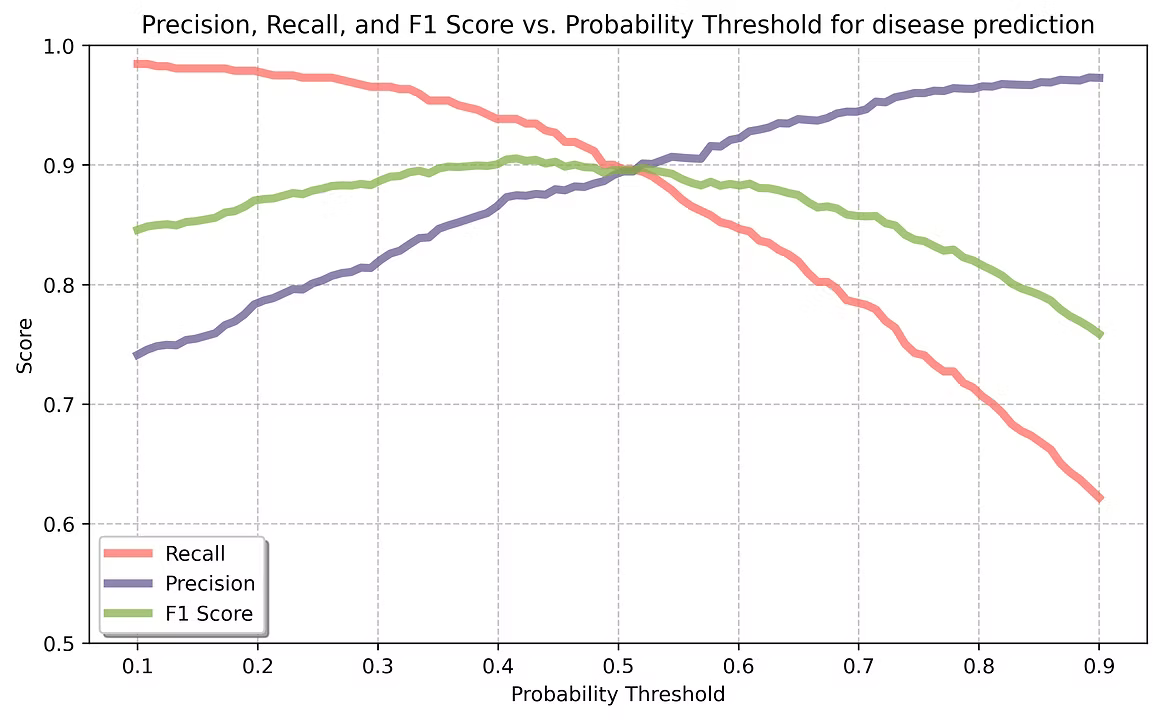
Since our models output probabilities (e.g., "Patient X has a 72% risk of diabetes"), we can adjust the threshold to optimize for different use cases:
- High-Specificity Mode (Higher Threshold) → Detects only the most severe cases to minimize false positives. This is useful for prioritizing high-risk patients who need immediate attention.
- High-Sensitivity Mode (Lower Threshold) → Identifies more potential at-risk patients, even if some might not develop the disease. This approach is valuable for early screening and preventive care.
By fine-tuning this threshold, doctors can balance between catching early cases (recall) and avoiding unnecessary alarms (precision), depending on the medical context.
Clustering: Identifying high-risk groups
Patient populations often contain hidden patterns that are difficult to detect manually. For instance, patients with hypertension may naturally form subgroups based on factors like age, family history, and lifestyle. Clustering algorithms automatically reveal these patterns, helping healthcare providers identify key groups and their distinct needs.
The scatter plot below illustrates how clustering can segment patients based on key metrics like age and blood pressure, without manual inspection:
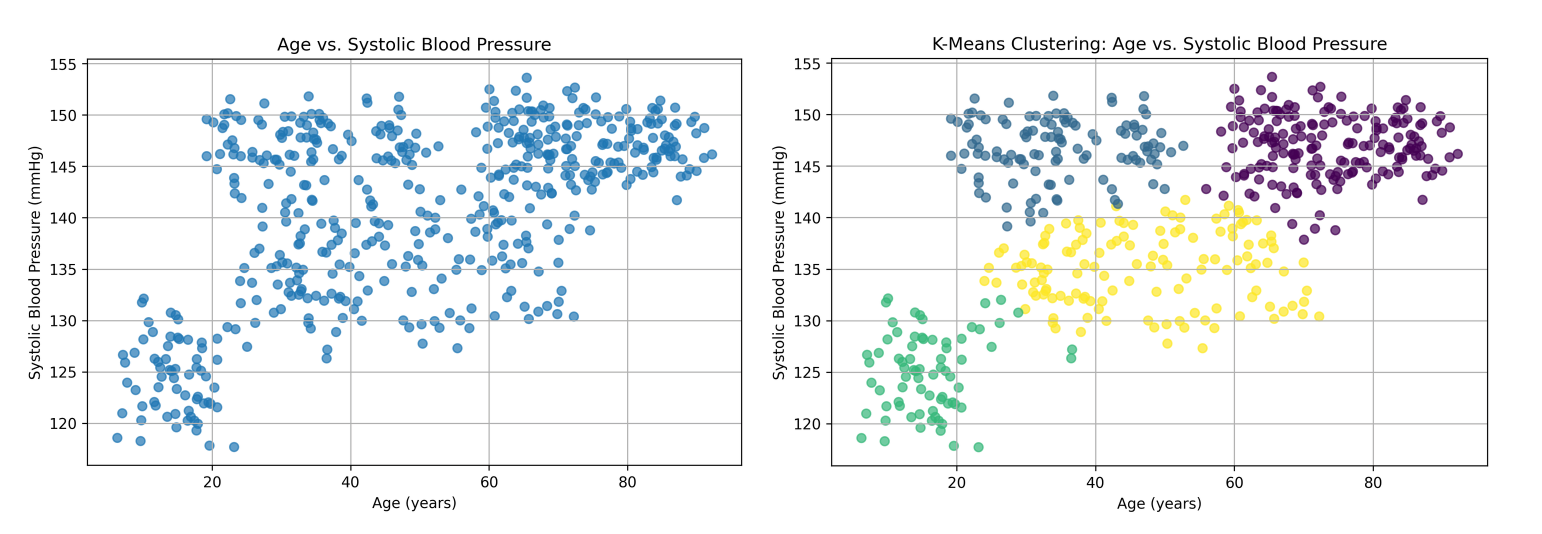
This analysis reveals several distinct groups of hypertensive patients, detected purely through unsupervised learning. It highlights the diversity within these patients, showing that high blood pressure affects different subgroups in unique ways. By identifying these groups, healthcare providers can better understand:
- Age-related patterns – Younger adults may have different risk factors than elderly patients.
- Health risks – Each group has unique health profiles requiring different management strategies.
- Personalized care – Targeted treatments can improve patient outcomes.
The table below provides a summary of the clustering results, showing the key characteristics of each group:
| Cluster | Count | Mean Age | Mean Systolic BP |
|---|---|---|---|
| Young adults with hypertension stage 2 | 114 | 34.5 | 147 |
| Adolescents with elevated BP | 73 | 16.1 | 126 |
| Elderly with hypertension stage 2 | 174 | 74.2 | 146 |
| Middle-aged adults with hypertension stage 1 | 137 | 52.4 | 135 |
By analyzing these patterns, healthcare providers can develop more effective, personalized interventions, improving disease management and patient care.
Real-world use cases
Our analysis and predictive models have been designed not just for internal research, but for real-world application in healthcare settings. To make our disease risk predictions and clustering insights widely accessible, we developed an external model as a service. This service can be easily integrated into various healthcare environments, offering a wide range of benefits:
Individual doctors and clinics
For individual healthcare providers, such as doctors during patient visits, the model provides real-time risk calculations and clustering insights. Doctors can use the disease risk scores and clustering results to:
- Assess individual patient risk: With each visit, doctors can calculate the likelihood of various diseases and adjust treatment plans accordingly.
- Make data-driven decisions: The model’s insights into potential risk factors enable more informed, personalized care during consultations.
Government and public health authorities
Clustering plays a crucial role in public health planning. By analyzing large-scale health data, governments can use clustering to:
- Identify high-risk communities: Clustering allows governments to spot population segments that may be at greater risk for disease outbreaks or chronic conditions (e.g., elderly, low-income neighborhoods with higher hypertension rates). This helps to prioritize areas for intervention.
- Target healthcare campaigns: Governments can design more effective public health campaigns by focusing on specific clusters, such as promoting lifestyle changes in young adults with elevated blood pressure or increasing diabetes awareness in certain demographic groups.
- Plan resource distribution: Clustering helps to understand which regions or demographics require more healthcare resources, ensuring that efforts are concentrated where they are most needed.
Conclusion: Key takeaways
Our journey in medical data analysis has demonstrated the power of structured healthcare data. Through predictive modeling, clustering, and semantic standardization, we transformed raw medical data into insights that can enhance patient care. Moving forward, such AI-driven approaches will continue to improve disease prevention and management.